
| Height in cm | 121-130 | 131-140 | 141-150 | 151-160 | 161-170 | 171-180 |
| No. of pupils | 12 | 16 | 30 | 20 | 14 | 8 |
Draw the ogive for the above data and from it determine the median (use graph paper).
Solution:
We write the given data in cumulative frequency table (in continuous distribution):
| Height | No. of students | Cumulative frequency c.f |
| 120.5-130.5 | 12 | 12 |
| 130.5-140.5 | 16 | 28 |
| 140.5-150.5 | 30 | 58 |
| 150.5-160.5 | 20 | 78 |
| 160.5-170.5 | 14 | 92 |
| 170.5-180.5 | 8 | 100 |
Plot the points (130.5, 12), (140.5, 28), (150.5, 58), (160.5, 78), (170.5, 92) and (180.5, 100) on the graph.
Join the points with the free hand. We get an ogive as shown:
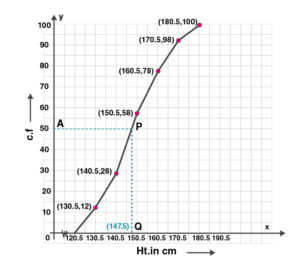
Here n = 100
Median = (n/2)th term
= 100/2
= 50th term
Mark point A(50) on Y axis. Draw a line parallel to X axis from A.
Let it meet the curve at P. Draw a straight line from P to X axis which meets at Q.
Q = 147.5
Hence median is 147.5.