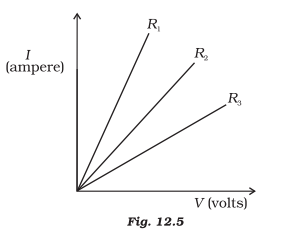
Solution: The answer is (c) R3 > R2 > R1
Resistance is inversely proportional to the amount of current flowing through it. Because the highest resistance will result in the least amount of current flow, the correct answer is c).

Solution: The answer is (c) R3 > R2 > R1
Resistance is inversely proportional to the amount of current flowing through it. Because the highest resistance will result in the least amount of current flow, the correct answer is c).