
Out of the following diagrams, which represent the T-P diagram?
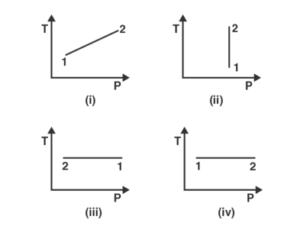
a) iv
b) ii
c) iii
d) i
Answer:
The correct option is c) iii
Explanation:
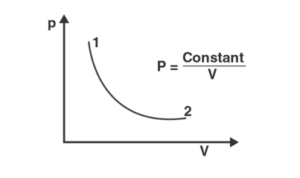
In the above-mentioned graph,
PV=constant
Moreover, PV=nRT
As a result, T=constant.
And as you progress from 1 to 2, the value of ‘P’ decreases. The graph in option satisfies these two requirements (iii)