
| Classes | 0-10 | 10-20 | 20-30 | 30-40 | 40-50 | 50-60 |
| Frequency | 2 | 8 | 10 | 5 | 4 | 3 |
Solution:
Construct histogram using given data.
| Classes | 0-10 | 10-20 | 20-30 | 30-40 | 40-50 | 50-60 |
| Frequency | 2 | 8 | 10 | 5 | 4 | 3 |
Represent classes on X-axis and frequency on Y-axis.
Take scale: X axis : 2 cm = 10 (class interval)
Y axis : 1 cm = 1 (frequency)
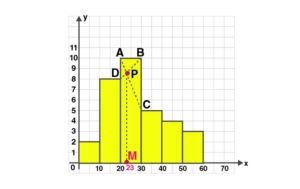
In the highest rectangle, draw two straight lines AC and BD.
P is the point of intersection.
Draw a vertical line through P to meet the X-axis at M.
The abscissa of M is 23.
Hence the mode is 23.