
The electrocardiogram, or ECG, is a graphical representation of the heart cycle generated by the electrograph. A typical ECG is depicted in the diagram below:
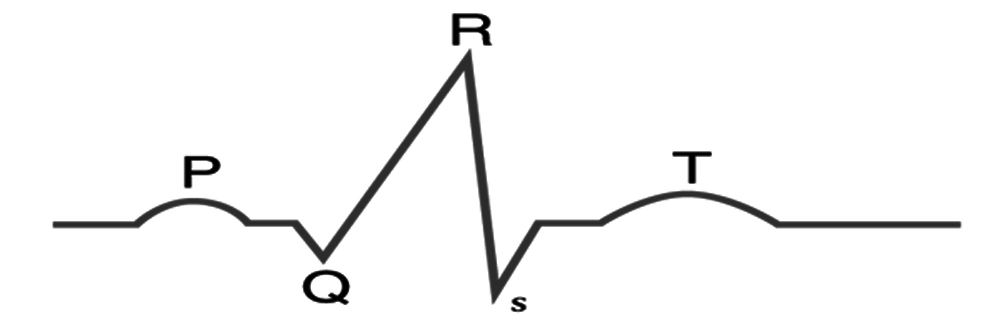
Each peak indicated by the letters ‘P’ to ‘T’ on the ECG corresponds to a specific electrical activity of the heart. The atrial contraction or depolarization is represented by the first peak, ‘P.’ The depolarization of the ventricles, or ventricular contraction, is shown by the QRS complex that follows. Finally, the T-wave denotes either ventricular relaxation or repolarization.