
T1 > T2 in the graph shown above. Because conductor resistance is higher at high temperature T1 than at low temperature T2, the straight line A is steeper than the line B. As a result, we may deduce that the resistance of a conductor increases as the temperature rises.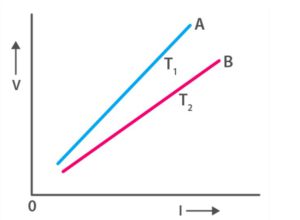
Draw a V – I graph for a conductor at two different temperatures. What conclusion do you draw from your graph for the variation of resistance of conductor with temperature?
Draw a V – I graph for a conductor at two different temperatures. What conclusion do you draw from your graph for the variation of resistance of conductor with temperature?


 and
and  , internal resistance
  and
and  , connected in parallel. The equivalent emf of the combination is- (A)
  (B)
(B)  (C)
(C)  (D)
(D) 
 and
and  are collinear, prove that
 and
and  be three points such that area of a
  is 4 sq units, find the value of
  .
. and
and  is 35 sq units.
 and
and  are collinear.
 and
and  are collinear.
 and
and  are collinear.
 and
and 