Given 

Multiplying by minus on both the sides, we’ll get

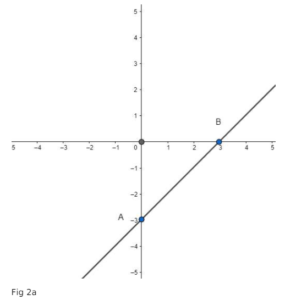
Consider the equation  .
.
Finding points on the coordinate axes:
If  , the
, the  value is – 3 i.e,
 the point on the
  axis is
If 

The point on the  axis is
Plotting the points on the graph: fig. 
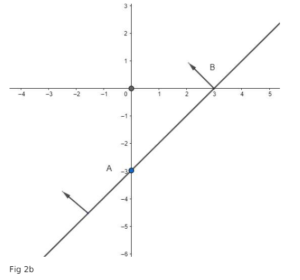
Now consider the inequality 
Here we need the y value greater than or equal to 
the required region is above point  .
.
Therefore the graph of the inequation  is fig.