Given 

Consider the equation 
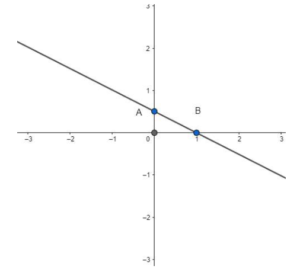
Finding points on the coordinate axes:
If  , the
, the  value is
  i.e.,
i.e., 
 the point on the
  axis is
If 
The point on the  axis is
Plotting the points on the graph: fig. 
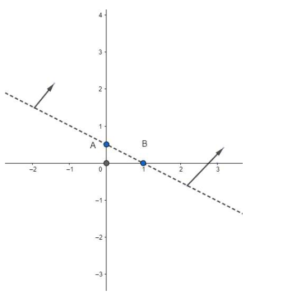
Now consider the inequality 
Here we need the  value greater than
the required region is above point  .
.
Also, the line  is represented in dotted line. This is s done because
Therefore the graph of the inequation is fig.