
| Height | 140-145 | 145-150 | 150-155 | 155-160 | 160-165 | 165-170 | 170-175 | 175-180 |
| No. of students | 12 | 20 | 30 | 38 | 24 | 16 | 12 | 8 |
Draw an ogive for the given distribution taking 2 cm = 5 cm of height on one axis and 2 cm = 20 students on the other axis.
Using the graph, determine :
(i)The median height.
(ii)The inter quartile range.
(iii) The number of students whose height is above 172 cm.
Solution:
We write the given data in cumulative frequency table.
| Height | No. of students | Cumulative frequency c.f |
| 140-145 | 12 | 12 |
| 145-150 | 20 | 32 |
| 150-155 | 30 | 62 |
| 155-160 | 38 | 100 |
| 160-165 | 24 | 124 |
| 165-170 | 16 | 140 |
| 170-175 | 12 | 152 |
| 175-180 | 8 | 160 |
Plot the points (145, 12), (150, 32), (155, 62), (160, 100), (165, 124), (170, 140), (175, 152), and (180, 160) on the graph.
Join the points with the free hand. We get an ogive as shown:
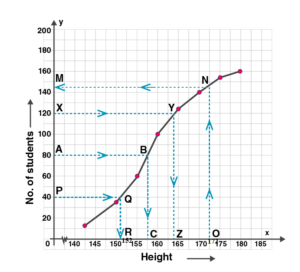
(i)Here n = 160
Median = (n/2)th term
= 160/2
= 80th term
Mark point A(80) on Y axis. Draw a line parallel to X axis from A.
Let it meet the curve at B. Draw a straight line from B to X axis which meets at C.
C = 157.5
Hence median is 157.5.
(ii) Lower quartile , Q1 = (n/4)th term
= 160/4
= 40th term
Proceeding in the same way mentioned in (i),
we get lower quartile = 152 [Point R]
Upper quartile, Q3 = 3n/4
= 3×160/4
= 3×40
= 120th term
Proceeding in the same way mentioned in (i),
we get upper quartile = 164 [Point Z]
Interquartile range = Q3-Q1
= 164-152
= 12
(iii)Mark a point O(172 ) on X axis. Draw a line parallel to Y axis from O.
Let it meet the curve at N. Draw a straight line from N to Y axis which meets at M.
M = 144
Hence number of students whose height is more than 172 cm is 160-144 = 16