| Height ( in cm ) | 150-155 | 155-160 | 160-165 | 165-170 | 170-175 | 175-180 | 180-185 |
| No. of workers | 6 | 12 | 18 | 20 | 13 | 8 | 6 |
(i) Determine the cumulative frequencies.
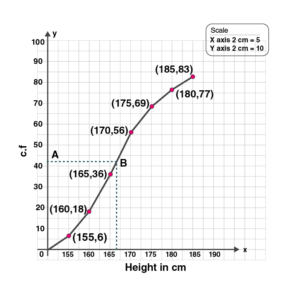
(ii) Draw the cumulative frequency curve on a graph paper. Use 2 cm = 5 cm height on one axis and 2 cm = 10 workers on the other.
(iii) From your graph, write down the median height in cm.
Solution:
(i) We write the given data in cumulative frequency table.
| Height in cm | No of workers f | Cumulative frequency |
| 150-155 | 6 | 6 |
| 155-160 | 12 | 18 |
| 160-165 | 18 | 36 |
| 165-170 | 20 | 56 |
| 170-175 | 13 | 69 |
| 175-180 | 8 | 77 |
| 180-185 | 6 | 83 |
(ii)Plot the points (155, 6), (160, 18), (165, 36), (170, 56), (175, 69), (180, 77) and (185, 83) on the graph.
Join the points with the free hand. We get an ogive as shown: