
| Height (in cm) | 140-150 | 150-160 | 160-170 | 170-180 | 180-190 |
| No. of students | 7 | 6 | 4 | 10 | 2 |
Solution:
Construct histogram using given data.
| Height (in cm) | 140-150 | 150-160 | 160-170 | 170-180 | 180-190 |
| No. of students | 7 | 6 | 4 | 10 | 2 |
Represent height on X-axis and number of students on Y-axis.
Take scale: X axis : 2 cm = 10 (class interval)
Y axis : 1 cm = 1 (frequency)
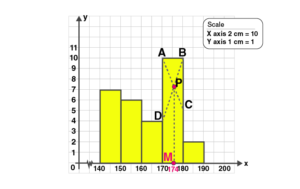
In the highest rectangle, draw two straight lines AC and BD.
P is the point of intersection.
Draw a vertical line through P to meet the X-axis at M.
The abscissa of M is 174.
Hence the mode is 174.