
Mass of body, m = 2 kg
Time, t = 0
Initial velocity, v1 = 0
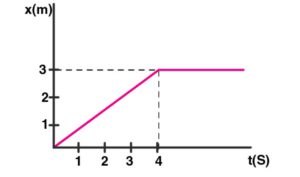
From graph, we know that
t ≥ 0 to t ≤ 4 which is a straight line.
The velocity of the body is constant
v2 = tan θ = 3/4 = 0.75 m/s
At t ≥ 4, the slope of the graph is zero so velocity v3 = 0
Impulse = Ft = (dp/dt)dt = dp
Impulse = change in momentum
Impulse at t = 0 is given as:
2(0.75 – 0) = 1.50 kg.m/s
Impulse at t = 4 is given as:
m(v3 – v2) = 2(0-0.75) = -1.50 kg.m/s
Impulse at t = 0 increases by +1.5 kg.m/s and at t = 4 it decreases by -1.5 kg.m/s.