Solution:
The weights of coffee in 70 jars is given
We now need to find the variance and standard deviation of the distribution
Let’s construct a table of the given data and append other columns after calculations
![Rendered by QuickLaTeX.com \[\begin{tabular}{|l|l|l|l|} \hline Weight (in grams) & Mid-Value $\left(\mathrm{x}_{\mathrm{i}}\right)$ & Frequency $\left(\mathrm{f}_{\mathrm{i}}\right)$ & $\mathrm{f}_{\mathrm{i}} x_{i}$ \\ \hline $200-201$ & $200.5$ & 13 & $13 \times 200.5=2606.5$ \\ \hline $201-202$ & $201.5$ & 27 & $27 \times 201.5=5440.5$ \\ \hline $202-203$ & $202.5$ & 18 & $18 \times 202.5=3645$ \\ \hline $203-204$ & $203.5$ & 10 & $10 \times 203.5=2035$ \\ \hline $204-205$ & $204.5$ & 1 & $1 \times 204.5=204.5$ \\ \hline $205-206$ & $205.5$ & 1 & $1 \times 205.5=205.5$ \\ \hline & Total & $\mathrm{N}=70$ & $\sum \mathrm{f}_{\mathrm{i}} x_{i}=14137$ \\ \hline \\ \end{tabular}\]](https://www.learnatnoon.com/s/wp-content/ql-cache/quicklatex.com-a86e9ea44a9a7f8ec0413f3ad5627c80_l3.png)
Mean, ![]()
Therefore the above table with more columns is shown below,
\begin{tabular}{|l|l|l|l|l|l|}
\hline Weight (in grams) & MidValue ![]() & Frequency
& Frequency ![]() &
& ![]()
![]() &
& ![]() &
& ![]() \\
\\
\hline ![]() &
& ![]() & 13 &
& 13 & ![]()
![]()
![]() &
& ![]()
![]() &
& ![]()
![]() \\
\\
\hline ![]() &
& ![]() & 27 &
& 27 & ![]()
![]()
![]() &
& ![]()
![]() &
& ![]()
![]() \\
\\
\hline ![]() &
& ![]() & 18 &
& 18 & ![]()
![]()
![]() &
& ![]()
![]() &
& ![]()
![]() \\
\\
\hline ![]() &
& ![]() & 10 &
& 10 & ![]()
![]()
![]() &
& ![]() 16 &
16 & ![]()
![]() \\
\\
\hline ![]() &
& ![]() & 1 &
& 1 & ![]()
![]()
![]() &
& ![]()
![]() &
& ![]()
![]() \\
\\
\hline ![]() &
& ![]() & 1 &
& 1 & ![]()
![]()
![]() &
& ![]()
![]() &
& ![]()
![]() \\
\\
\hline & Total & ![]() & &
& & ![]() &
& ![]()
![]() \\
\\
\hline
\end{tabular}
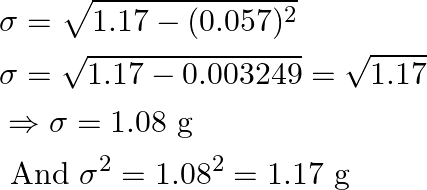
And the standard deviation is

Substitute the values from above table,


As a result, the variance and standard deviation of the distribution are respectively ![]() and
and ![]() .
.

![Rendered by QuickLaTeX.com \[\begin{tabular}{|l|l|} \hline Weight (in grams) & Frequency \\ \hline $200-201$ & 13 \\ \hline $201-202$ & 27 \\ \hline $202-203$ & 18 \\ \hline $203-204$ & 10 \\ \hline $204-205$ & 1 \\ \hline $205-206$ & 1 \\ \hline \end{tabular}\]](https://www.learnatnoon.com/s/wp-content/ql-cache/quicklatex.com-c0bc6df090fc5305ccf0b694d1521306_l3.png)