Solution:
It is given that there are 60 students in a class. Also the frequency distribution of the marks obtained by the students in a test is given.
We now need to find the mean and the standard deviation of the marks.
Given that there are 60 students in the class, so
\section{![]() }
}
![]()
![]()
![]()
![]()
Splitting the middle term, we get
![]()
![]()
![]()
![]() or
or ![]()
![]() or
or ![]()
Given ![]() is a positive number, so
is a positive number, so ![]() can take 4 as the only value.
can take 4 as the only value.
And let’s say the assumed mean, ![]() .
.
Putting ![]() and
and ![]() in the frequency distribution table and add other columns after calculations, we obtain
in the frequency distribution table and add other columns after calculations, we obtain
![Rendered by QuickLaTeX.com \[\begin{tabular}{|l|l|l|l|l|} \hline Marks $\left(x_{i}\right)$ & Frequency $\left(f_{i}\right)$ & $d_{i}=x_{i}-a$ & $f_{i} d_{i}$ & $f_{i} d_{i}^{2}$ \\ \hline 0 & $x-2=4-2=2$ & $-3$ & $-6$ & 18 \\ \hline 1 & $x=4$ & $-2$ & $-8$ & 16 \\ \hline 2 & $x^{2}=4^{2}=16$ & $-1$ & $-16$ & 16 \\ \hline 3 & $(x+1)^{2}=25$ & 0 & 0 & 0 \\ \hline 4 & $2 x=8$ & 1 & 4 & 8 \\ \hline 5 & $x+1=5$ & 2 & 10 & 20 \\ \hline Total & 60 & & $-12$ & 78 \\ \hline \end{tabular}\]](https://www.learnatnoon.com/s/wp-content/ql-cache/quicklatex.com-fc36d47d7ee61924bfc4e41334fd7b03_l3.png)
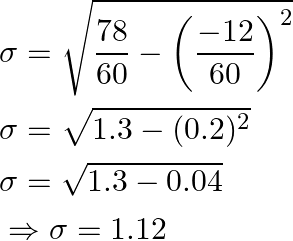
And it is known that the standard deviation is

Substitute values from above table,

As a result, the standard deviation is ![]()
The mean is
![]()
![]()
![]()
![]()
As a result, the mean and standard deviation of the marks are respectively ![]() and
and ![]() .
.

![Rendered by QuickLaTeX.com \[\begin{tabular}{|l|l|l|l|l|l|l|} \hline Marks & 0 & 1 & 2 & 3 & 4 & 5 \\ \hline Frequency & $x-2$ & $x$ & $x^{2}$ & $(x+1)^{2}$ & $2 x$ & $x+1$ \\ \hline \end{tabular}\]](https://www.learnatnoon.com/s/wp-content/ql-cache/quicklatex.com-d1c25739bda1e53fe838cb056af8bda4_l3.png)