
| Pocket expenses (in Rs) | Number of students
(Frequency ) |
| 0-5 | 10 |
| 5-10 | 14 |
| 10-15 | 28 |
| 15-20 | 42 |
| 20-25 | 50 |
| 25-30 | 30 |
| 30-35 | 14 |
| 35-40 | 12 |
Draw a histogram representing the above distribution and estimate the mode from the graph.
Solution:
Construct histogram using given data.
Represent classes on X-axis and frequency on Y-axis.
Take scale: X axis : 2 cm = 5 (class interval)
Y axis : 1 cm = 5 (frequency)
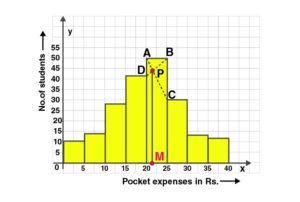
In the highest rectangle, draw two straight lines AC and BD.
P is the point of intersection.
Draw a vertical line through P to meet the X-axis at M.
The abscissa of M is 21.
Hence the mode is 21.