
| Weight (gm) | 50-60 | 60-70 | 70-80 | 80-90 | 90-100 | 100-110 | 110-120 | 120-130 |
| Frequency | 8 | 10 | 12 | 16 | 18 | 14 | 12 | 10 |
(i) Calculate the cumulative frequencies.
(ii) Draw the cumulative frequency curve and from it determine the median weight of the potatoes. (1996)
Solution:
(i)We write the given data in cumulative frequency table.
| Marks | frequency f | Cumulative frequency c.f |
| 50-60 | 8 | 8 |
| 60-70 | 10 | 18 |
| 70-80 | 12 | 30 |
| 80-90 | 16 | 46 |
| 90-100 | 18 | 64 |
| 100-110 | 14 | 78 |
| 110-120 | 12 | 90 |
| 120-130 | 10 | 100 |
(ii)To represent the data in the table graphically, we mark the upper limits of the class intervals on
the horizontal axis (x-axis) and their corresponding cumulative frequencies on the vertical axis ( y-axis),
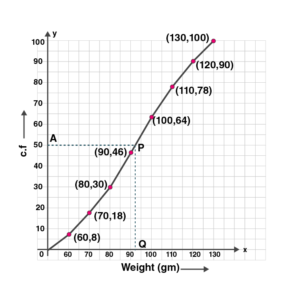
Plot the points (60, 8), (70, 18), (80, 30), (90, 46), (100, 64), (110, 78), (120, 90) and (130, 100) on the graph.
Join the points with the free hand. We get an ogive as shown:
Here n = 100 which is even.
So median = ( n/2 th term)
= (100/2 th term)
= (50 th term)
Now mark a point A (50) on the Y-axis and from A draw a line parallel to X-axis meeting the curve at P. From P, draw a perpendicular on x-axis meeting it at Q.
Q is the median.
Q = 93 gm.
Hence the median is 93.