


Solution:

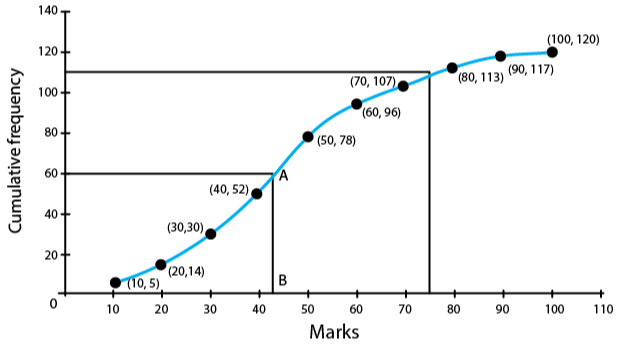

(i) Median 

Draw a parallel line to 


Therefore, the value of point B is the median 

(ii) No. of students who obtained up to 75% marks in the test 

No. of students who obtained more than 75% marks in the test 
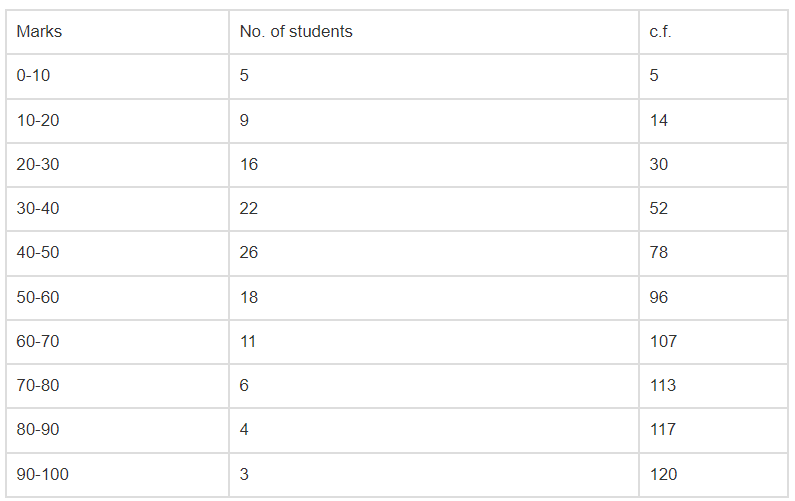
![\[\begin{tabular}{|l|l|} \hline Marks & No. of students \\ \hline $0-10$ & 5 \\ \hline $10-20$ & 9 \\ \hline 20-30 & 16 \\ \hline 30-40 & 22 \\ \hline 40-50 & 26 \\ \hline 50-60 & 18 \\ \hline 60-70 & 11 \\ \hline 70-80 & 6 \\ \hline 80-90 & 4 \\ \hline $90-100$ & 3 \\ \hline \end{tabular}\]](https://www.learnatnoon.com/s/wp-content/ql-cache/quicklatex.com-3d939708b60fb284722ae41b9c43cbb9_l3.png "Rendered by QuickLaTeX.com")

Solution:
(i) Median
Draw a parallel line to
Therefore, the value of point B is the median
(ii) No. of students who obtained up to 75% marks in the test
No. of students who obtained more than 75% marks in the test
