
Answer:
Consider the following diagram:
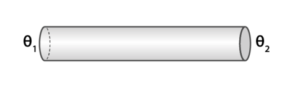
From the diagram, this much can be said that:

The temperature changes in a linear fashion from θ1 to θ2. Let us assume that θ is the temperature at the rod’s middle. As a result, the average temperature at the rod’s midpoint is reported as:

![L={{L}_{0}}\left[ 1+\alpha \left( \frac{{{\theta }_{1}}+{{\theta }_{2}}}{2} \right) \right]](https://www.learnatnoon.com/s/wp-content/ql-cache/quicklatex.com-d6a31598a07253f8681823ba53c90506_l3.png "Rendered by QuickLaTeX.com")