
![\[\begin{tabular}{|l|l|l|l|l|l|l|l|l|l|} \hline Marks & $10-$ & 20 & $30-$ & $40-$ & $50-$ & $60-$ & $70-$ & $80-$ & $90-$ \\ \hline & 19 & $-29$ & 39 & 49 & 59 & 69 & 79 & 89 & 99 \\ \hline No. of students & 14 & 16 & 22 & 26 & 18 & 11 & 6 & 4 & 3 \\ \hline \end{tabular}\]](https://www.learnatnoon.com/s/wp-content/ql-cache/quicklatex.com-3cf2e6cad45525cfa646857b1bb5c14f_l3.png "Rendered by QuickLaTeX.com")
Solution:
![\[\begin{tabular}{|l|l|l|} \hline Marks & No. of students & Cumulative frequency \\ \hline $9.5-19.5$ & 14 & 14 \\ \hline $19.5-29.5$ & 16 & 30 \\ \hline $29.5-39.5$ & 22 & 52 \\ \hline $39.5-49.5$ & 26 & 78 \\ \hline $49.5-59.5$ & 18 & 96 \\ \hline $59.5-69.5$ & 11 & 107 \\ \hline $69.5-79.5$ & 6 & 113 \\ \hline $79.5-89.5$ & 4 & 117 \\ \hline $89.5-99.5$ & 3 & 120 \\ \hline \end{tabular}\]](https://www.learnatnoon.com/s/wp-content/ql-cache/quicklatex.com-b4014569bd82182b422ad3233334b105_l3.png "Rendered by QuickLaTeX.com")
Scale:
 marks on
  axis
axis
 students on
  axis
axis
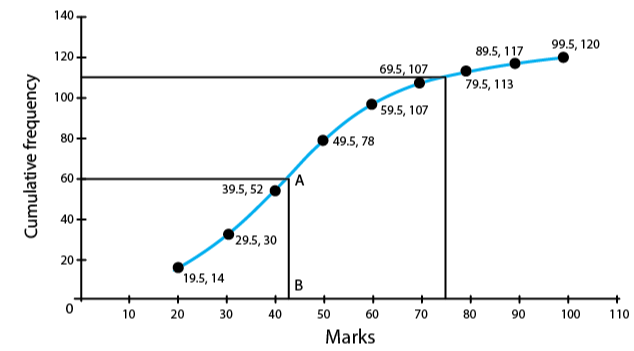
(i) Therefore, the median  term
term
Draw a parallel line to  through mark
  which meets the curve at A. Now from A, draw a perpendicular to meeting it at B.
Value of point B is the median 
(ii) Total marks 
75% of total marks  marks
marks
As a result, the no. of students getting more than 75% marks  students.


 and
and  , internal resistance
  and
and  , connected in parallel. The equivalent emf of the combination is- (A)
  (B)
(B)  (C)
(C)  (D)
(D) 
 and
and  are collinear, prove that
 and
and  be three points such that area of a
  is 4 sq units, find the value of
  .
. and
and  is 35 sq units.
 and
and  are collinear.
 and
and  are collinear.
 and
and  are collinear.
 and
and 