
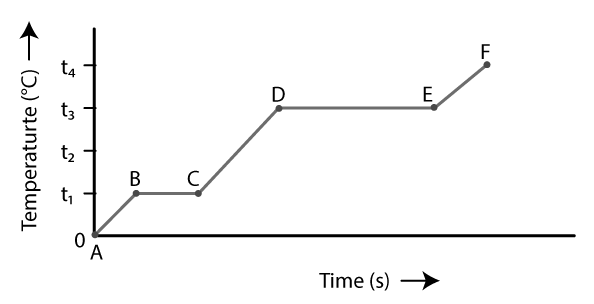
(a)What do parts AB, BC, CD and DE represent?
(b) What is the melting point of the substance?
(c) What is the boiling point of the substance?
Solution:
(a) The AB section depicts the solid’s temperature rise from 0 degrees C to to 10 degrees C.
At 10 degrees C, the BC component begins to melt.
The temperature of the liquid rises from 10 degrees C to 30 degrees C in the CD section.
The boiling at 30 degrees C is shown in the DE portion.
(b) The substance’s melting point is 10 degrees C.
(c) The substance’s boiling point is 30 degrees C.


 and
and  , internal resistance
  and
and  , connected in parallel. The equivalent emf of the combination is- (A)
  (B)
(B)  (C)
(C)  (D)
(D) 
 and
and  are collinear, prove that
 and
and  be three points such that area of a
  is 4 sq units, find the value of
  .
. and
and  is 35 sq units.
 and
and  are collinear.
 and
and  are collinear.
 and
and  are collinear.
 and
and 