
| Scores | 0-10 | 10-20 | 20-30 | 30-40 | 40-50 | 50-60 | 60-70 | 70-80 | 80-90 | 90-100 |
| No. of shooters | 9 | 13 | 20 | 26 | 30 | 22 | 15 | 10 | 8 | 7 |
Use your graph to estimate the following:
(i) The median.
(ii) The interquartile range.
(iii) The number of shooters who obtained a score of more than 85%.
Solution:
We write the given data in cumulative frequency table.
| Scores | No of shooters f | Cumulative frequency c.f |
| 0-10 | 9 | 9 |
| 10-20 | 13 | 22 |
| 20-30 | 20 | 42 |
| 30-40 | 26 | 68 |
| 40-50 | 30 | 98 |
| 50-60 | 22 | 120 |
| 60-70 | 15 | 135 |
| 70-80 | 10 | 145 |
| 80-90 | 8 | 153 |
| 90-100 | 7 | 160 |
To represent the data in the table graphically, we mark the upper limits of the class intervals on
the horizontal axis (x-axis) and their corresponding cumulative frequencies on the vertical axis ( y-axis),
Plot the points (10, 9), (20, 22), (30, 42), (40, 68), (50, 98), (60, 120), (70, 135), (80, 145), (90, 153) and (100, 160) on the graph.
Join the points with the free hand. We get an ogive as shown:
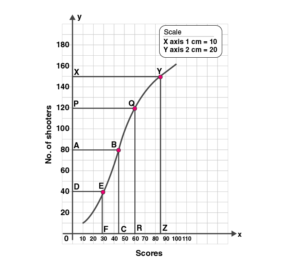
(i)Here n = 160, which is even.
So median = n/2 = 80
Now mark a point A(80) on the Y-axis and from A draw a line parallel to X-axis meeting the curve at B. From P, draw a perpendicular on x-axis meeting it at C.
C is the median.
C = 44
(ii) lower quartile, Q1 = (n/4)th term
= 160/4
= 40
Now mark a point D(40) on the Y-axis and from that point draw a line parallel to X-axis meeting the curve at E. From E, draw a perpendicular on x-axis meeting it at F.
F = 29
So Q1= 29
Upper quartile, Q3 = (3n/4)th term
= 3×160/4
= 3×40
= 120
Mark a point P(120) on the Y-axis and from that point draw a line parallel to X-axis meeting the curve at Q. From Q, draw a perpendicular on x-axis meeting it at R.
R = 60
So Q3 = 60
Inter quartile range = Q3– Q1
= 60-29
= 31
Hence the Inter quartile range is 31.
(iii) Mark a point Z(85) on the X axis.
From Z on X-axis, draw a perpendicular to it meeting the curve at Y. From Y, draw a line parallel to X-axis meeting Y-axis at X. X is the required point which is 150.
Number of shooters getting more than 85% scores = Total number of shooters – number of shooters who got till 85% = 160-150 = 10.
Hence the number of shooters getting more than 85% scores is 10.