
| Marks | 0-10 | 10-20 | 20-30 | 30-40 | 40-50 | 50-60 | 60-70 | 70-80 |
| Frequency | 3 | 8 | 12 | 14 | 10 | 6 | 5 | 2 |
Also state the median class
Solution:
Arranging the data in cumulative frequency table.
| Marks | Frequency | Cumulative frequency |
| 0-10 | 3 | 3 |
| 10-20 | 8 | 11 |
| 20-30 | 12 | 23 |
| 30-40 | 14 | 37 |
| 40-50 | 10 | 47 |
| 50-60 | 6 | 53 |
| 60-70 | 5 | 58 |
| 70-80 | 2 | 60 |
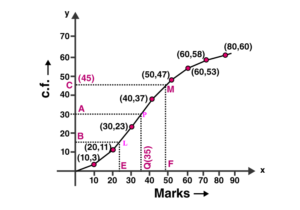
To represent the data in the table graphically, we mark the upper limits of the class intervals on
the horizontal axis (x-axis) and their corresponding cumulative frequencies on the vertical axis ( y-axis).
Plot the points (10, 3), (20, 11), (30, 23), (40, 37), (50, 47), (60, 53), (70, 58) and (80, 60) on the graph.
Join the points with the free hand. We get an ogive as shown:
(i)Here number of observations, n = 60 which is even.
So median = ( n/2) th term
= (60/2) th term
= 30 th term
Mark a point A(30) on Y-axis. From A, draw a horizontal line parallel to X-axis meeting the curve at P. From P draw a line perpendicular to the x-axis which meets it at Q.
Q is the median .
Q = 35
Hence the median is 35 .
(ii) Lower quartile, Q1 = n/4 = 60/4 = 15th term
Upper quartile, Q3 = 3n/4 = 3×60/4 = 45th term
Mark a point B(15) and C(45) on Y-axis. From B and C, draw a horizontal line parallel to X-axis meeting the curve at L and M respectively. From L and M, draw lines perpendicular to the x-axis which meets it at E and F respectively.
E is the lower quartile .
E = 22.3
F is the upper quartile.
F = 47
Inter quartile range = Q3-Q1
= 47-22.3
= 24.7
Hence interquartile range is 24.7.