a) P1 > P2
b) P1 = P2
c) P1 < P2
d) data is insufficient
Answer:
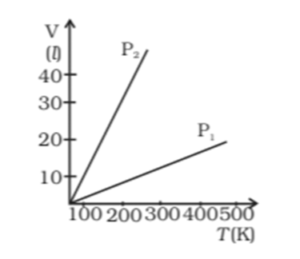
The correct option is a) P1 > P2
Explanation: When the pressure of an ideal gas is constant, Chale’s law is obeyed, i.e. V ∝ T = constant

a) P1 > P2
b) P1 = P2
c) P1 < P2
d) data is insufficient
Answer:
The correct option is a) P1 > P2
Explanation: When the pressure of an ideal gas is constant, Chale’s law is obeyed, i.e. V ∝ T = constant