Consider the reaction A B. The concentration of both the reactants and the products varies exponentially with time. Which of the following figures correctly describes the change in concentration of reactants and products with time?

NCERT Exemplar Solutions of Class 12 Chemistry Chapter 4 Chemical Kinetics-6


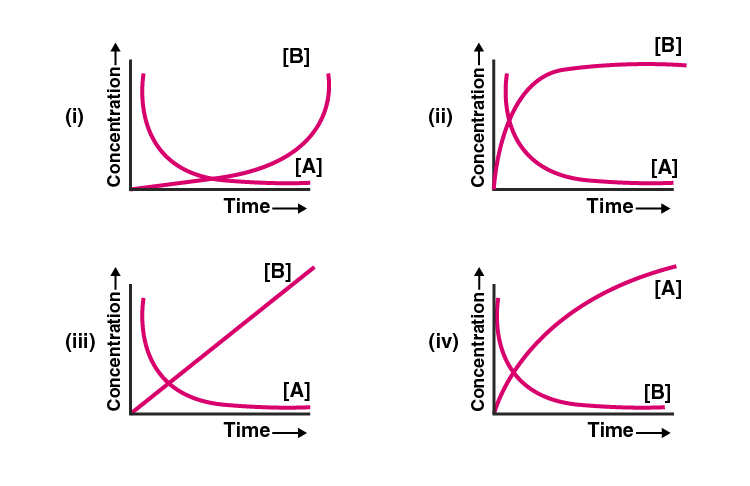
Correct Answer: Option (ii)

Explanation: The graph in the option (ii) describes the change in concentration of reactants and products with time.