
| Wt. in kg | 40-44 | 45-49 | 50-54 | 55-59 | 60-64 | 65-69 |
| No. of students | 2 | 8 | 12 | 10 | 6 | 4 |
Hence estimate the modal weight.
Solution:
The given distribution is not continuous.
Adjustment factor = (45-44)/2 = ½ = 0.5
We subtract 0.5 from lower limit of the class interval and add 0.5 to upper limit.
So the new table in continuous form is given below.
| Weight in kg | Number of students
(Frequency ) |
| 39.5-44.5 | 2 |
| 44.5-49.5 | 8 |
| 49.5-54.5 | 12 |
| 54.5-59.5 | 10 |
| 59.5-64.5 | 6 |
| 64.5-69.5 | 4 |
Construct histogram using given data.
Represent weight on X-axis and no. of students on Y-axis.
Take scale: X axis : 2 cm = 5 (class interval)
Y axis : 1 cm = 1 (frequency)
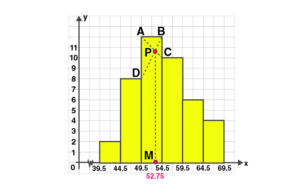
In the highest rectangle, draw two straight lines AC and BD.
P is the point of intersection.
Draw a vertical line through P to meet the X-axis at M.
The abscissa of M is 52.75.
Hence the mode is 52.75.