
| Mid value | 12 | 18 | 24 | 30 | 36 | 42 | 48 |
| Frequency | 20 | 12 | 8 | 24 | 16 | 8 | 12 |
Also state the modal class.
Solution:
| Mid value | Frequency |
| 12 | 20 |
| 18 | 12 |
| 24 | 8 |
| 30 | 24 |
| 36 | 16 |
| 42 | 8 |
| 48 | 12 |
Here mid value and frequency is given.
We can find the class size, h by subtracting second mid value from first mid value.
h = 18-12 = 6
So to find the lower limit of class interval, we subtract h/2 to the mid value.
To find the upper limit of class interval, we add h/2 to the mid value.
Here h/2 = 6/2 = 3
So lower limit = 12-3 = 9
Upper limit = 12+3 = 15
So the class interval is 9-15
Likewise we find the class interval of other values.
| Mid value | Class interval | Frequency |
| 12 | 9-15 | 20 |
| 18 | 15-21 | 12 |
| 24 | 21-27 | 8 |
| 30 | 27-33 | 24 |
| 36 | 33-39 | 16 |
| 42 | 39-45 | 8 |
| 48 | 45-51 | 12 |
Construct histogram using given data.
Take scale: X axis : 2 cm = 6 (class interval)
Y axis : 1 cm = 2 (frequency)
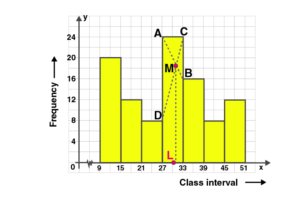
In the highest rectangle, draw two straight lines AB and CD.
M is the point of intersection.
Draw a vertical line through M to meet the X-axis at L.
The abscissa of L is 30.5.
Hence the mode is 30.5.
Modal class is the class with highest frequency.
Hence the modal class is 27-33.