Solution:
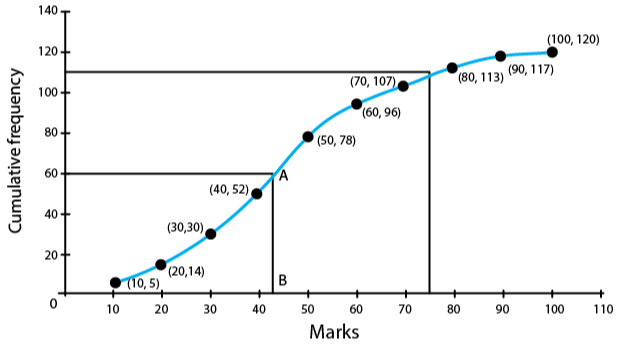
(i) No. of students who obtained less than 40% marks in the test  (from the graph;
  ,
,  )
)
(ii) Lower quartile  term
term 

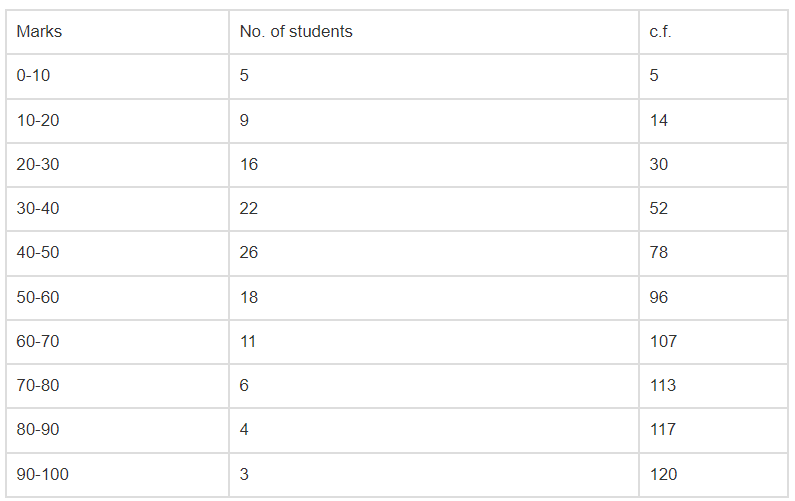
![\[\begin{tabular}{|l|l|} \hline Marks & No. of students \\ \hline $0-10$ & 5 \\ \hline $10-20$ & 9 \\ \hline 20-30 & 16 \\ \hline 30-40 & 22 \\ \hline 40-50 & 26 \\ \hline 50-60 & 18 \\ \hline 60-70 & 11 \\ \hline 70-80 & 6 \\ \hline 80-90 & 4 \\ \hline $90-100$ & 3 \\ \hline \end{tabular}\]](https://www.learnatnoon.com/s/wp-content/ql-cache/quicklatex.com-3d939708b60fb284722ae41b9c43cbb9_l3.png "Rendered by QuickLaTeX.com")
Solution:
(i) No. of students who obtained less than 40% marks in the test (from the graph; , )
(ii) Lower quartile term


![\[\begin{array}{l} \square \vec{r}=(\hat{i}+\hat{j})+\lambda(2 \hat{i}-\hat{j}+\hat{k}) \\ \vec{r}=(2 \hat{i}+\hat{j}-\hat{k})+\mu(3 \hat{i}-5 \hat{j}+2 \hat{k}) \end{array}\]](https://www.learnatnoon.com/s/wp-content/ql-cache/quicklatex.com-2f8ab5b81e582387cb9ae472791476e4_l3.png "Rendered by QuickLaTeX.com")
![\left[\mathrm{Ni}(\mathrm{CN})_{4}\right]^{-2}](https://www.learnatnoon.com/s/wp-content/ql-cache/quicklatex.com-c5a91864ba7e1e0ed1b5d273d822f5e5_l3.png "Rendered by QuickLaTeX.com") (b)
(b) ![\left[\mathrm{Pd}(\mathrm{CN})_{4}\right]^{2-}](https://www.learnatnoon.com/s/wp-content/ql-cache/quicklatex.com-ffda616d3dbe7dc8925722e87005924e_l3.png "Rendered by QuickLaTeX.com") (c)
(c) ![\left[\mathrm{PdCl}_{4}\right]^{2-}](https://www.learnatnoon.com/s/wp-content/ql-cache/quicklatex.com-90cc6a4f4d42dee46e06d6f8ed516b7a_l3.png "Rendered by QuickLaTeX.com") (d)
(d) ![\left[\mathrm{NiCl}_{4}\right]^{2}](https://www.learnatnoon.com/s/wp-content/ql-cache/quicklatex.com-149ee5c95bd9cfcc4405704fba2e1bab_l3.png "Rendered by QuickLaTeX.com")
 (d) all of these